Section B.7 Function Notation and Transformation of Graphs
¶Subsection Function Notation
The calculator uses \(Y_1 (X)\text{,}\) \(Y_2 (X)\text{,}\) and so on, instead of \(f (x)\text{,}\) \(g(x)\text{,}\) and so on, for function notation.
Example B.42.
Evaluate \(f (x) = x^2 + 6x + 9\) for \(x = 3\text{.}\)
Set \(Y_1 = X^2 + 6X + 9\text{,}\) and quit (
2ndMODE) to the Home screen.-
To evaluate this function for \(X = 3\text{,}\) press
VARS\(\boxed{\rightarrow}\)ENTERENTER(\(3\))ENTERSee Figure B.43.
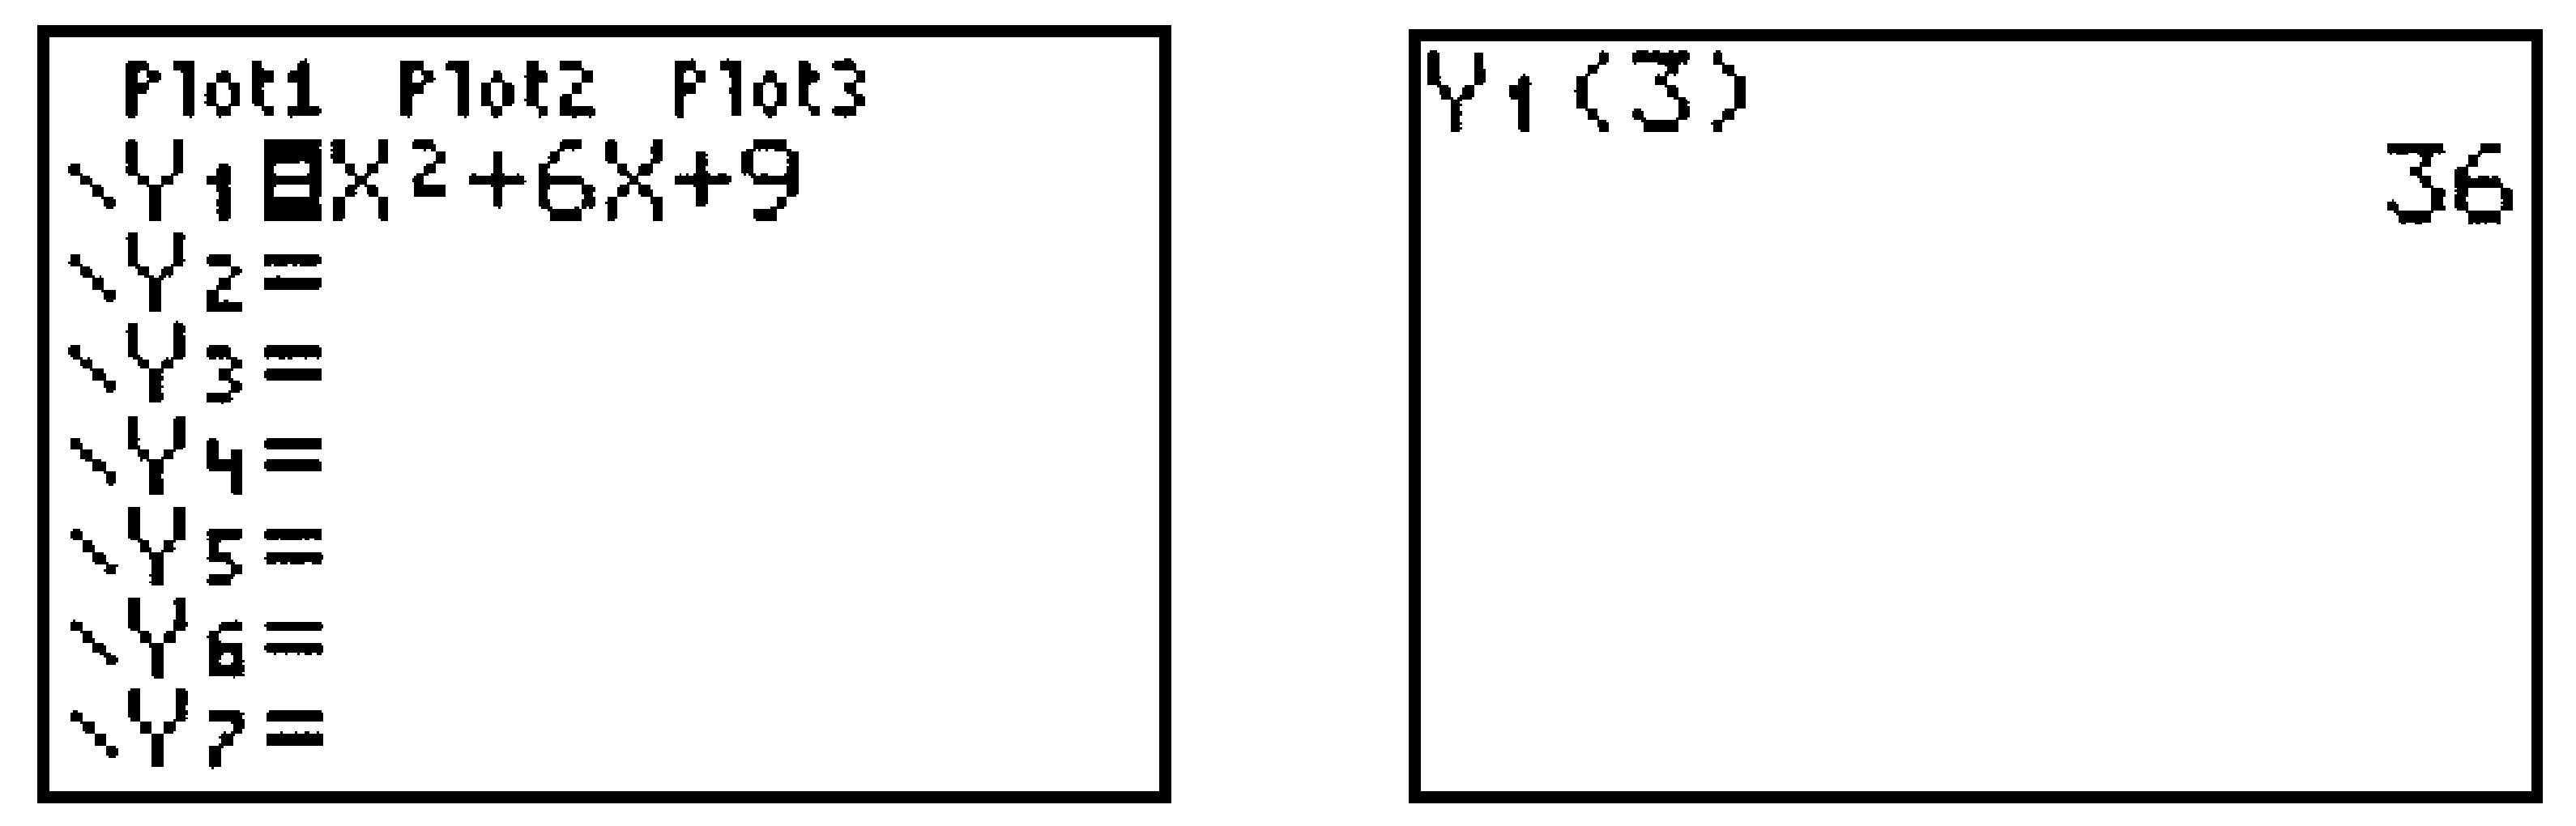
Figure B.43.
Subsection Transformation of Graphs
We can use function notation to facilitate graphing transformations. In the examples below, we use \(f (x) = x^2\text{.}\)
Subsubsection Translations
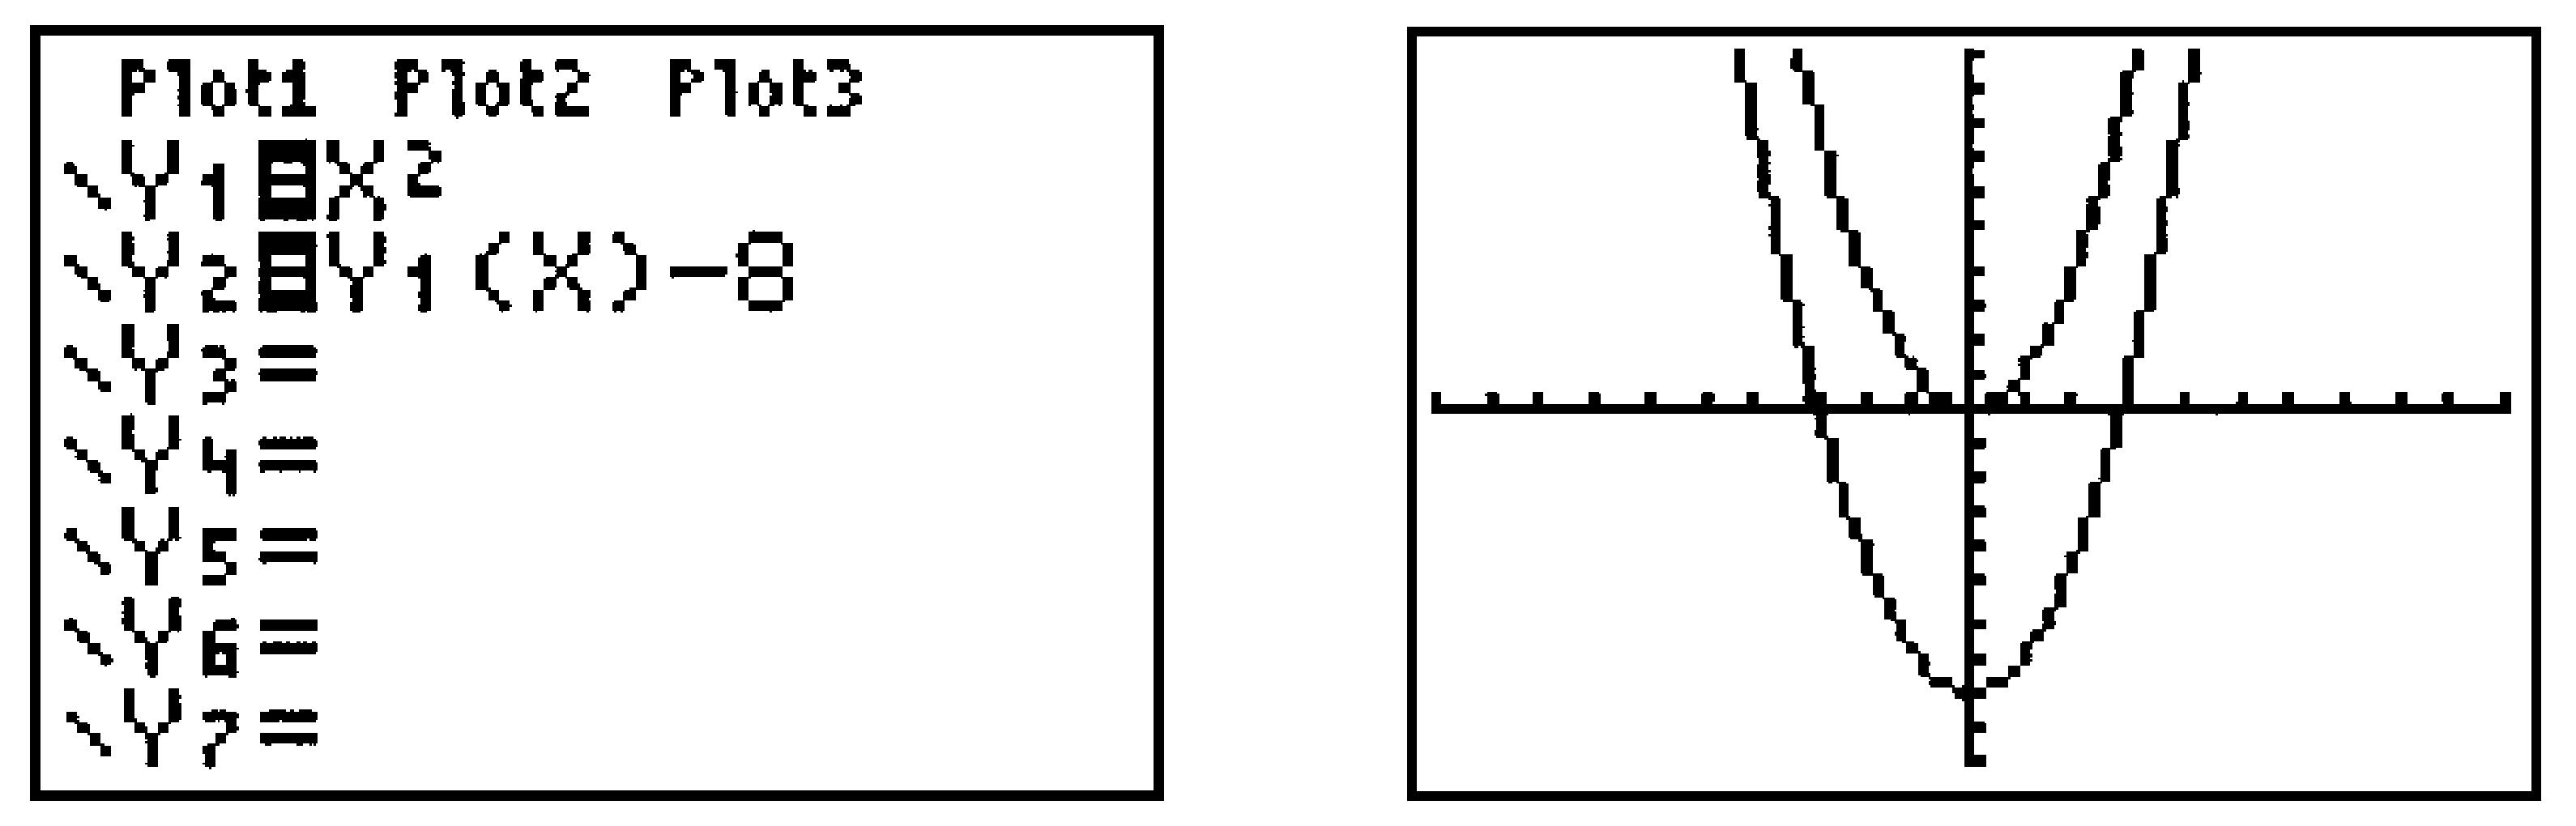
Example B.44.
Compare the graphs of \(y = f (x) - 8\) and \(y = f (x - 8)\) with that of \(y = f (x)\text{.}\)
Define \(Y_1 = X^2\) and \(Y_2 =Y_1(X) - 8\) . Press ZOOM \(6\) to see the graphs (Figure B.45).
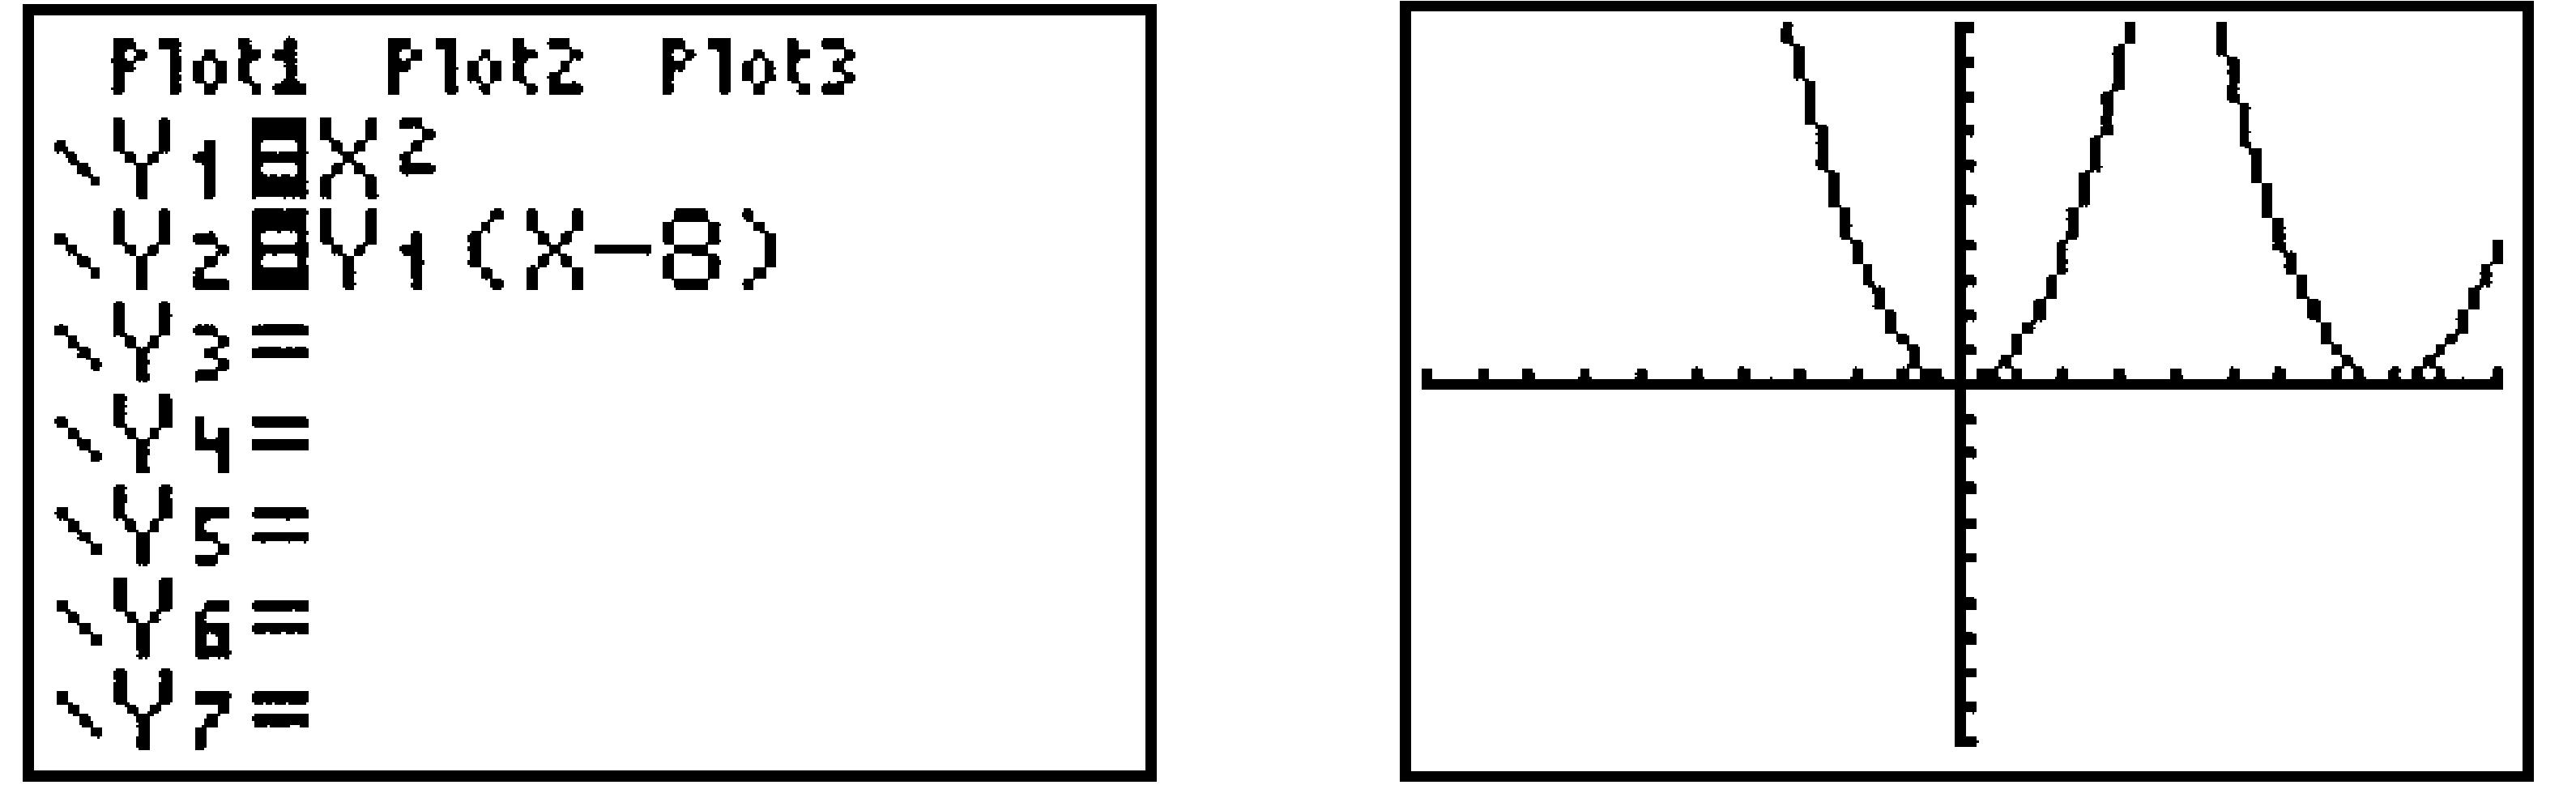
Define \(Y_1 = X^2\) and \(Y_2 =Y_1(X - 8)\text{.}\) Press ZOOM \(6\) to see the graphs (Figure B.46).
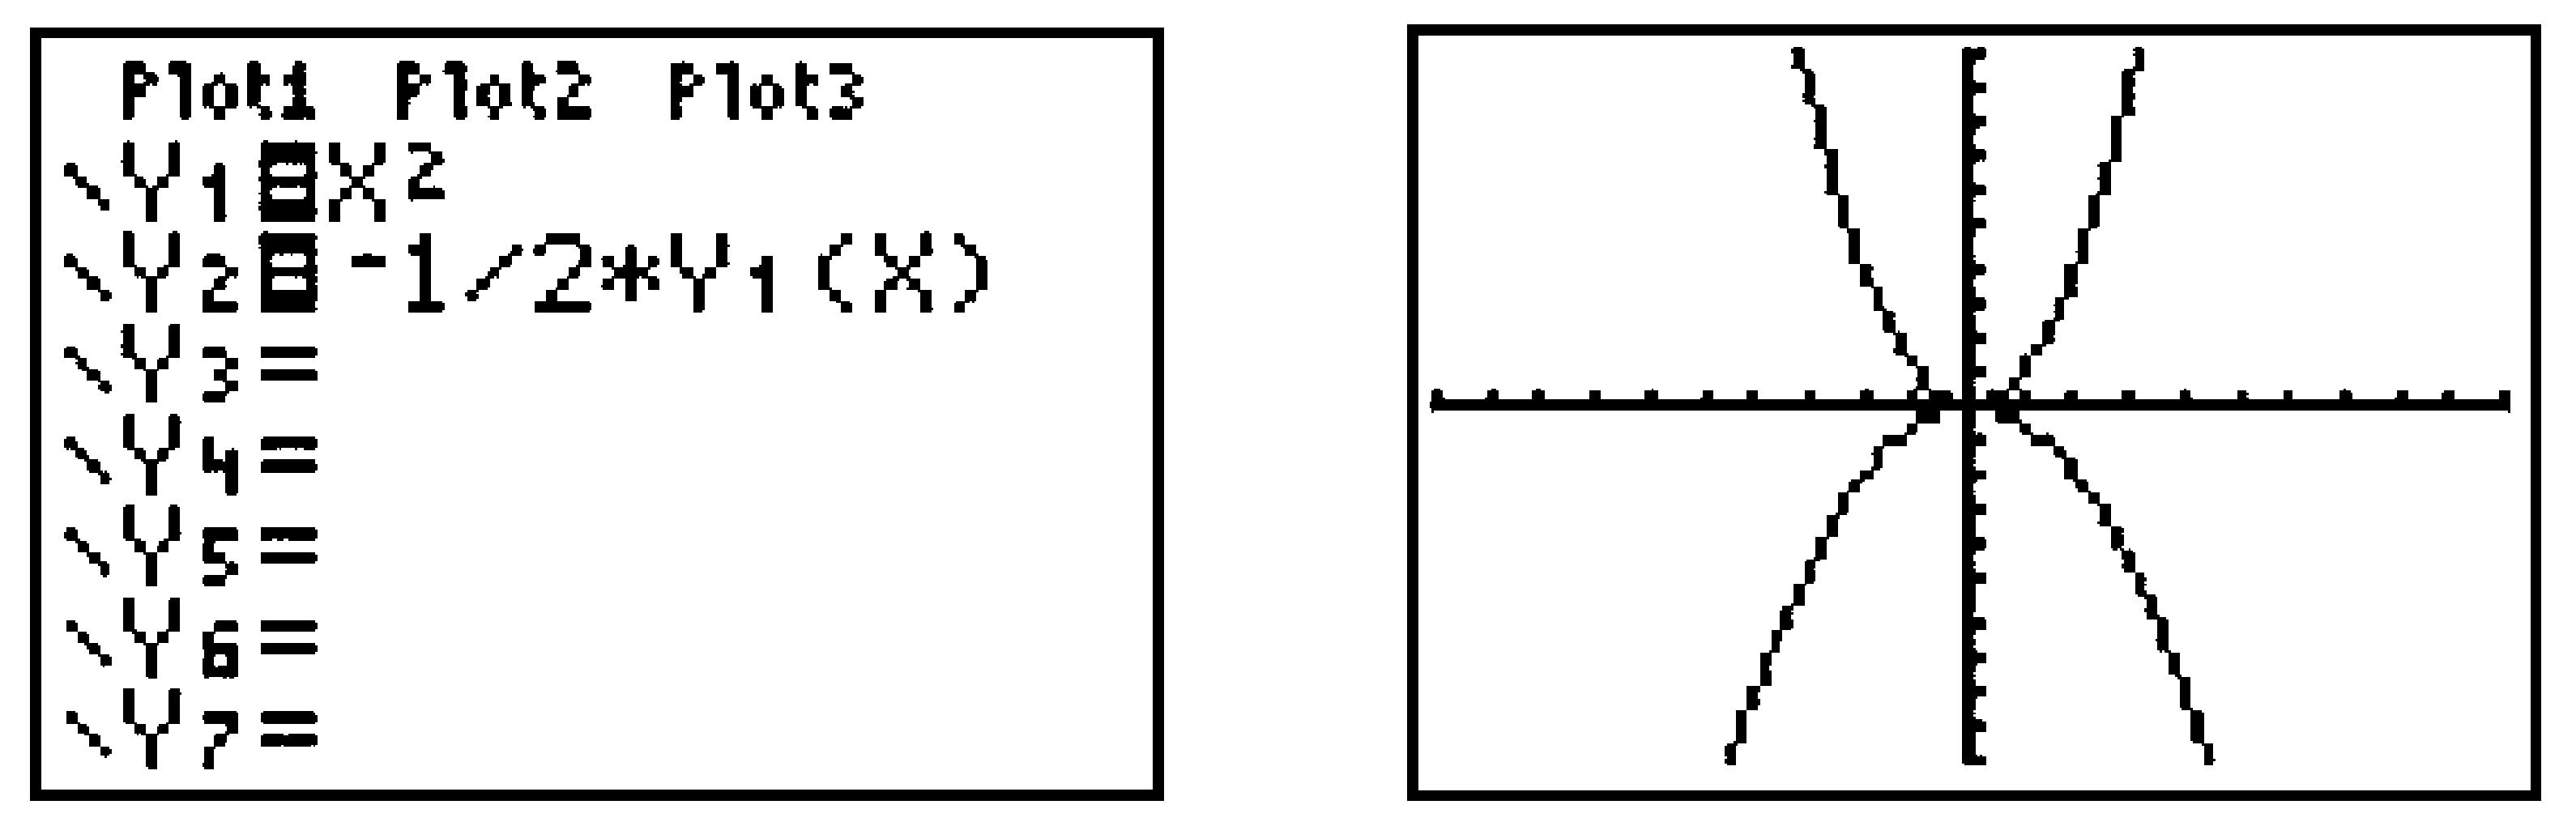
Subsubsection Vertical Scalings and Reflections
Compare the graph of \(y = \frac{-1}{2} f (x)\) with that of \(y = f (x)\text{.}\)
Define \(Y_1 = X^2\) and \(Y_2 = -1/2*Y_1(X)\text{.}\) Press to see the graphs (Figure B.47).